Thursday, April 25, 2024

Six Free Alternatives to GeoGuessr

I am a huge fan of GeoGuessr, but unfortunately without becoming a paid subscriber it is now a very limited game. I don't blame GeoGuessr for developing its subscription model. The Google Maps API isn't cheap and I'm sure Google sends GeoGuesssr huge invoices every month. However that does mean there is a huge potential market for a free Street View game. A market that OpenGuessr now hopes to exploit.

Wikidata Guessr

a photo of the Deutschhaus in Mainz and a small inset world map

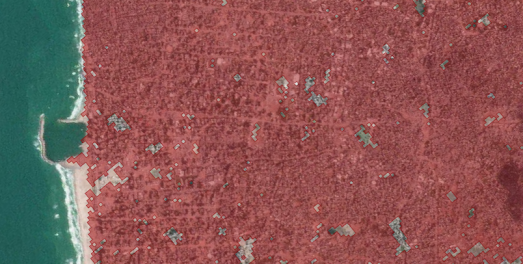
Let's start with the hardest challenge! Wikidata Guessr is a fun game which involves trying to identify the locations shown in images randomly selected from the Wikidata knowledge base. 

The only problem with Wikidata Guessr is that identifying the locations depicted in still images can be incredibly difficult. The difficulty level of Wikidata Guessr means that I would personally start with some of the other GeoGuessr games listed on this page, especially if you are a novice GeoGuessr player. 

If you are a GeoGuessr pro then you will probably love the challenge posed by Wikidata Guessr. If you do find Wikidata Guessr challenging then you might find some of the thematic rounds (such as parliament buildings, rollwercoasters or mountains) a little easier to play.

Backdrop

a screenshot of backdrop showing the painting of a town square nest to an map of Europe
Backdrop is probably the best game ever devised in the history of mankind (full disclosure - I developed Backdrop myself, so I may be a little biased).

Backdrop is a map based game which is somewhat similar to the very popular GeoGuessr game. However in Backdrop instead of Google Maps Street View images you have to identify the locations depicted in famous pictures painted by some of history's greatest artists.

In GeoGuessr you can stroll around in Street View to pick-up clues as to the location that you have been dropped in. In Backdrop if you don't immediately recognize the scene depicted in the painting there are only a couple of clues available to you. Usually the title of the painting is a huge clue as to the location that is depicted. If that doesn't help then the name of the gallery where the painting is located might be a clue as to the location shown in the artwork (although it might also be a complete red herring). 

Each game of Backdrop involves identifying the locations of 5 paintings chosen at random. You win points based purely on how close you click to the correct location.

You might also enjoy Backdrop.Tripgeo, a series of GeoGuessr type games that I have developed with Tripgeo. These individual games require you to identify the locations depicted in other types of images, these include vintage photos, postcards, movie stills, satellite images and even holiday snaps. 

OpenGuessr

screenshot of OpenGuessr showing the Hagia Sofia in Istanbul

Very much like GeoGuessr the new OpenGuessr is an online geography game that uses Google Maps Street View images to drop players in random locations around the world. Players must then use the clues from their surroundings to guess where they are on the map. The closer their guess is to the actual location, the more points they earn. 

The 'open' in OpenGuessr very much refers to being open or free to play. The game itself is not open-source and it doesn't use open-sourced map data or panoramic imagery. In fact like GeoGuessr the new OpenGuessr game uses Google Map's proprietary data and imagery. Which does make me wonder how long OpenGuessr can survive itself before it will have to start charging users to play.

TimeGuessr

If you are looking for other free alternatives to GeoGuessr then you might also enjoy TimeGuessr. TimeGuessr is another very similar game to GeoGuessr - except in TimeGuessr you are asked to identify the location shown in a photograph rather than the location of a Google Street View panorama. 

As the name 'TimeGuessr' suggests this game also comes with an additional requirement. Like Geoguessr this game requires you to guess a location by dropping a pin on an interactive map, however in TimeGuessr you are also required to guess the time, or rather the 'date' when the image was captured. For me the extra dimension of time in TimeGuessr actually makes it more fun to play. Now as well as using the visual clues to try to determine where in the world a photograph was taken you also have to use the same visual clues to work out in what year the picture was captured. 

Cityguessr

screenshot of cityguessr showing a street view of a rainy street in Bristol

GeoGuessr fans should also have no problem understanding how to play Cityguessr. In Cityguessr you are shown a Street View panorama of a random city. All you have to do is identify the city using the visual clues (street signs, street furniture, architectural signs etc) within the Street View images. 

In most cities you can explore a little by using the arrow signs in Street View to move yourself around. However you only have 135 seconds before you have to make a guess. Unfortunately sometimes Cityguessr gives you a user submitted Street View and you are unable to explore - which can make identifying the correct city very difficult. It's still fun to try though and if you do guess right it makes it even more satisfying.

City Guesser

City Guesser is a fun location guessing game, which requires you to identify a location revealed in a video and point to it on an interactive map. 

The game shows you a random video of someone walking around a city or a famous monument. You have to pick up on the visual clues in the video (such as the languages & words used in street signs and the design of the street furniture) to identify where you think the video was shot. Once you have made your guess you just need to click on the location on an interactive map and you are awarded points based on how close you got to the real location. 

There are a number of different games that you can play. You can choose to view videos just from one country - or you can play either a Worldwide or Europe game - featuring videos from across the world or from just within Europe.

The Stunning Beauty of Air Traffic Data

a map of flight paths in and out of Denver Airport

The ADS-B Massive Visualizer allows you to query and visualize the world's air traffic data. Using the visualizer you can query 50 billion flight data records, enabling you to:

  • map the flight paths of different types of aircraft anywhere in the world
  • visualize the flight patterns of military aircraft
  • track police aircraft
  • observe the effect of war on civilian airline flight paths

These are only a few examples of the hundreds of different types of queries that you can make with the ADS-B Massive Visualizer. The map itself comes with a number of predefined queries that hint at the huge number of possible queries that you can make with the visualizer. 

If you want to format your own queries then you will need to refer to the visualizer's GitHub page, specifically the section titled Database and Queries. The project's GitHub page also includes a large number of screenshots of mapped queries made using the visualizer. These screenshots may give you lots of other ideas about how you can query the database.

map showing the flightpaths of helicopters in London

The possible queries seem endless and hugely fascinating. For example this query of helicopter flights over London shows that many helicopter pilots like to follow the river Thames, as far as the Isle of Dogs in the East End where they turn northwards and then follow the River Lea up through the Olympic Park (or vice versa if traveling in the opposite direction.

map of helicopter flight paths in New York City

One reason why helicopters may follow rivers while flying through cities is to avoid all those tall buildings. For example in this query you can see that in New York helicopters avoid the city's massive skyscrapers by following the Hudson and East River.

Please let me know in the comments if you find any other interesting queries. You can just grab the URL of the ADS-B Massive Visualizer to share the map of your query with the world.

Via: Quantum of Sollazzo

Wednesday, April 24, 2024

America's Drunkest Counties

chorpleth map of USA showing levels of excessive drinking in each state

America's Booziest and Driest Counties is a choropleth map which shows the percentage of the population in each US county who are excessive drinkers. The map is based on data from the Centers for Disease Control and Prevention (CDC), which defines excessive drinking as either binge drinking (men 5 drinks in a single session, women 4 drinks in a single session) or heavy drinking (men drinking more than 15 drinks in a week, women drinking 8 drinks in a week).

The map shows that many of the driest counties are also some of the most religious. For example Utah, whose population is over 50% Mormon, is one the direst states on the map. Consequently Utah has some of the most restrictive laws related to the buying and selling of alcohol. Much of the bible belt also seem to have some of the driest counties in the USA.

At the other end of the scale most counties in Wisconsin have a very high percentage of excessive drinkers. The reason for this may be partly cultural and partly due to the state alcohol laws (in Wisconsin people under the legal drinking age may be served, possess, or consume alcohol if they are with a parent, legal guardian, or spouse who is of legal drinking age).

Kentucky and West Virginia both have a large number of very dry counties. I read an interesting theory last week (I can't remember where so unfortunately I can't credit this) that this may be related to the heavy use of opiates in these states (West Virginia has the highest rate of deaths from drug overdose of all states).

The CDC has also mapped out the percentage of excessive drinking by state. The CDC ranks each state based on the percentage of the population who reported binge or heavy drinking. Utah, Kentucky and Alabama respectively top the rankings with the least percentage of heavy drinkers. North Dakota (50), Montana (49) and Iowa (48) have the highest number of excessive drinkers (Wisconsin comes in at 47th).

Tuesday, April 23, 2024

Mapping a Global Coral Bleaching Event

an animated GIF of ABC News' globe of global coral bleaching

Last week the National Oceanic and Atmospheric Administration (NOAA) reported that the 'world is currently experiencing a global coral bleaching event'. The Earth has experienced 10 consecutive months of global heat records,  and in the last year the average global temperature has exceeded pre-industrial levels by 1.58C. These unprecedented sudden rises in air surface temperatures are having a devastating effect on the world's coral reefs.

When the oceans get too warm, corals expel the algae that live within them. This algae provides the corals with vital nutrients and without this algae the corals turn white or pale and are much more susceptible to disease and death.

Australia's ABC News has mapped out the extent of coral bleaching in coral reefs around the world. A 3D globe in The Great Ocean White-Out visualizes the current level of risk to coral reefs. The map uses the reef bleaching alert scale to show the level of risk to individual coral reefs.  The map shows that coral bleaching is now a global problem and, according to ABC News, "For the first time ever, coral (is) bleaching on both the Atlantic and the Pacific side of Panama at the exact same time".

In NOAA's announcement of a Global Coral Bleaching Event the agency reports that this is the second global bleaching event in just the last ten years. NOAA suggests that this "global event requires global action". Which is in itself extremely worrying as the world's governments seem unwilling to even meet the voluntary emissions targets that they set themselves in the 2015 Paris Agreement on climate change.


Monday, April 22, 2024

Tiny World Map

Tiny World Map is a map of the whole wide world condensed into a very small file size. It has been designed to be used offline and with low-bandwidth web apps. The whole map is only 300 kB gzipped and apparently it works on even "low-end decade-old phones, with no discernible lag".

The main reason that Tiny World Map is so small is because it isn't much of a map. As far as I can tell Tiny World Map consists almost entirely of a very low resolution country border layer, a layer of country placename labels, and the placename labels of the '10,000 most populous cities'. 

Of course using such course mapping data means that the map is not very accurate - for example if you zoom in on coastlines around the world you will start to notice that many city placename labels are displayed off the coast, suggesting that these cities are located somewhere under water. 

The map uses service workers which means that you don't have to download anything onto your phone in order to use the map when you are offline. You just need to visit Tiny World Map when you have internet access and the map should be cached so that you can then use the map even when you don't have access to an internet connection.

However I am struggling to think of a use-case for Tiny World Map. I can't think of an occasion when I might need a low resolution map which only contains country borders and the labels of the so-called 10,000 most populous cities in the world - even when I'm offline. 

The fact that I can't think of a use case for Tiny World Map doesn't mean that there isn't one. I've never understood the point of what3words and that's now a global multi-million dollar company. 

Saturday, April 20, 2024

Slim City

For a number of years I've had the idea of creating an incremental game which involves slowly creating a city map by adding different map elements over time. This week I decided to try and put that idea into action. The result is Slim City, an idle game which requires you to click on building footprints on an interactive map to build and create a map of a city neighborhood.

In Slim City the more buildings you own then the more of the city map is completed. Each day you earn rent from all the buildings that you own. So, if you run out of money, you just need to wait until the city clock reaches midnight.

And that's it really. To be honest - as it stands Slim City isn't much of a game. I could improve the game by adding more city management features but I am actually going to stop developing this game for now and maybe later start from scratch on version two of Slim City. 

There are a couple of reasons for starting a new version of the game. The first is that at the moment the game has to make lots of calls to the Overpass API to fetch the map data. This really isn't a good idea. My idea now is to instead download all the OpenStreetMap data for a small 200 meter x 200 meter area. I can then re-purpose that data in any way that I require to enable players to slowly add features to a city neighborhood map during a game - without having to make lots of calls to the Overpass API.

The second reason that I'm going to start from scratch on SlimCity 2.0 is that I now have a better idea for some fun city management elements that can be added to the game. I think that these ideas will work better if I start over from the beginning and bake in these features from the very start of development.

Friday, April 19, 2024

⅓ of Rafah’s Buildings Destroyed

satellite imagery of Rafah showing damaged buildings and tents

Bloomberg has analysed satellite imagery of the Palestinian city of Rafah and determined that Israel has damaged or destroyed about 32% of the region's buildings.

In How the Israel-Hamas War has Reshaped Rafah in Gaza Bloomberg presents a satellite image of the Palestinian city. As you scroll through the article a layer is superimposed on top of this satellite view to show buildings which have been damaged (in orange) and tents or other new structures (in yellow). As you scroll south across the region it is impossible to not be shocked by the devastating destruction of the region by the Israeli attacks.

The Bloomberg analysis used machine learning to compare two satellite images of the region - one image captured in November of last year and a more recent satellite image captured at the end of March. The machine learning model was trained to look for tents and for new structures. In the article Bloomberg also reports that 'Across the entire Gaza Strip, about 56% of buildings have been damaged'.

a close-up satelitte view of a Gaza neighborhood colored almost completely red

The Guardian has also used satellite imagery and open-source evidence to map the mass destruction of buildings and land in Gaza. In January the newspaper published a story-map How war destroyed Gaza’s neighbourhoods, which guides you through satellite imagery of three neighborhoods in Gaza (Beit Hanoun, al-Zahra and Khan Younis) documenting the destruction of civilian infrastructure by Israel.

The destroyed buildings in the satellite imagery in The Guardian's map are colored red. However, as the map automatically pans over Gaza, it quickly becomes apparent that it would have been easier for The Guardian to color in the undestroyed buildings as there is very little civilian infrastructure left in the three neighborhoods.

As well as the satellite imagery of Israel's destruction of civilian infrastructure the map is illustrated with video evidence of the Israeli attacks. This destruction of civilian infrastructure by Israel includes bombed schools, mosques, hospitals and people's homes. So far 1.9 million people have been forced to leave their homes in Gaza and, according to The Guardian, the scale of destruction carried out by Israel has "led some experts to describe what is happening in Gaza as 'domicide', ... widespread, deliberate destruction ... preventing the return of displaced people." 

a satellite view of Gaza with lots of damaged buildings colored red

In November a researcher at UCL's CASA released an interactive mapping tool to help researchers and news agencies "estimate the number of damaged buildings and the pre-war population in a given area within the Gaza Strip". The Gaza Damage Proxy Map is based on an earlier tool which was developed to estimate damage caused by Russia in Ukraine.

The Gaza Damage Proxy Map colors individual buildings in the Gaza Strip to indicate the probability that the building has suffered damage since October 10, 2023. If you use the map's drawing tool you can highlight an area of the Gaza Strip on the map. The Gaza Damage tool will then automatically estimate the number of damaged buildings in the highlighted area and the estimated affected population. The percentage of the buildings damaged in the area is also calculated for you. If you select individual damaged buildings on the map you can view information on the date of the damage and view a link to the source media for the damage report.

The Gaza Damage Proxy map uses Synthetic Aperture Radar imagery captured by satellites to detect damaged buildings. By measuring the change in the intensity of these radar waves since before the Israeli attacks on Gaza it is possible to estimate the probability that individual buildings have been damaged. Damage points from the UN Satellite Office (UNOSAT) have also been used to validate the accuracy of the damage detection algorithm used by the map. The map itself also includes an optional layer which adds geo-located footage of strikes and destruction in Gaza as triangular map markers.

You can learn more about the methodology used to estimate building damage in Gaza in the Bellingcat article, A New Tool Allows Researchers to Track Damage in Gaza.

Thursday, April 18, 2024

The American Home Values Map

a dot density mao of the USA showing home vaues

Home Values in America is a dot density map showing the self-reported value of homes across the whole United States.The map shows home values across the United States using data from the U.S. Census Bureau's 2018-2022  American Community Survey (ACS). The ACS  is a large-scale survey that gathers information about the American population every year.

The colored dots on the map show the self-reported values of owner-occupied homes. These values are self-reported by ACS respondents when asked the question "how much do you think this house and lot, apartment, or mobile home (and lot, if owned) would sell for if it were for sale?" The dots on the map don't reflect the actual locations of respondents. Each dot is mapped randomly within its census block location.

The map legend shows the values of each color of dot on the map. This legend is interactive which means that you can turn on or off different values on the map, allowing you to explore the density of the most expensive or cheapest homes in a city or any combination of the mapped home values.

You can learn more about the methodology behind the making of the map on the project's GitHub page.

Wednesday, April 17, 2024

The 2024 Cicadapocalypse

a cicada brood map showing in which year cicada broods will emerge in the USA

2024 is set to see the emergence of two large periodical cicada broods. Both Brood XIX (13-year cicada) and Brood XIII (17-year cicada), are expected to emerge together in 2024 for the first time since 1803. This double emergence has been nicknamed a "cicada-geddon" by some.

Periodical cicadas are native to eastern North America. They spend most of their lives underground as nymphs, feeding on tree root fluids. Depending on the species, they live either 13 or 17 years underground before emerging as adults. As adults periodical cicadas emerge in massive groups called broods. Nearly all the individuals in a brood emerge above ground within a few weeks of each other.

Axios has created a mapped timeline to visualize in which year and where in the USA each of the 13-year cicada and 17-year will emerge and in which year there will be a double emergence. In this visualization a map of the eastern USA is encompassed by two time wheels (a 13-year and 17-year time wheel). Select a year on this map and the two time wheels rotate to show you which broods (if any) will emerge that year.

The Axios article Is 2024 the Cicadapocalypse or a Cicadapalooza? also includes an interactive map which allows you to enter a city in the eastern USA to see in which years the city will experience a cicada brood emergence. 

map showing past sightings of cicada broods
According to the University Of Connecticut's overview of the 2024 Periodical Cicada Emergence, although both Brood XIX and Brood XIII will emerge in 2024 they will "not overlap to any significant extent." 

The university has mapped out past positive presence records of both Brood XIX and Brood XIII. On this map positive presence records of Brood XIII are represented by images of upwards facing cicadas and positive presence records of Brood XIX are represented by images of downwards facing cicadas. The map allows you to see where the two broods have emerged in previous years.

The university also says that even if both broods do emerge in the same area there probably won't be a higher density of cicadas than if only one brood emerged, because "Competition for resources (e.g., food, space, or ovipisition sites) is expected to impose an upper limit on cicada densities".

Monday, April 15, 2024

Backdrop - the Ultimate Challenge

a creenshot of Backdrop showing a map and landscape painting of a church in Warsaw
Backdrop

Backdrop is a map based game which is somewhat similar to the very popular GeoGuessr game. However in Backdrop instead of Google Maps Street View images you have to identify the locations depicted in famous paintings by some of history's greatest artists.

In GeoGuessr you can stroll around in Street View to pick-up clues as to the location that you have been dropped in. In Backdrop if you don't immediately recognize the scene depicted in the painting there are only a couple of clues available to you. Usually the title of the painting is a huge clue as to the location that is depicted. If that doesn't help then the name of the gallery might be a clue as to the location shown in the artwork (although it might also be a complete red herring). 

Currently there are around 200 paintings from around the world in the Backdrop database. Each game of Backdrop involves identifying the locations of 5 paintings chosen at random. You win points based purely on how close you click to the correct location.

Backdrop.Tripgeo

A couple of months ago I gave Tripgeo a preview of Backdrop and he pointed out that the game could work equally well with any type of image. He volunteered to create an editor that could be used to create a Backdrop game with any uploaded images. The result is Backdrop.Tripgeo, a series of GeoGuessr type games, using paintings, vintage photos, postcards, movie stills and holiday snaps.

The Backdrop editor developed by Tripgeo means that it is very easy and quick to create individual Backdrop games. If you have some images that you think might make a good game get in contact and we might be able to help you turn them into your very own Backdrop map game.