
We are definitely witnessing a mini revolution in the presentation of building age maps.
A couple of weeks ago the map team at the City of Amsterdam released Housing Plans, an animated map of new housing projects in Amsterdam. In a Twitter conversation with the creators of the map I remarked that I'd been waiting for someone to create a similar animated map, using building age data to show how a city has grown over time.
Within 24 hours the City of Amsterdam responded with the Amsterdam Growing Over Time map. This incredible animated map shows how the city of Amsterdam developed and grew from a few houses in the 17th century into the dynamic city it is today.
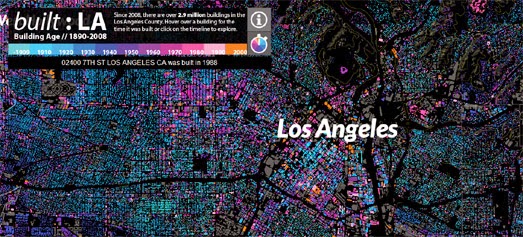
Thanks to cityHUB Los Angeles you can now also watch an animated map showing Los Angeles development in the 20th Century. The LA Building Age map visualizes the age of nearly 3 million buildings in Los Angeles. The colors of the building footprints on the map show the decade of when the buildings were originally built (you can also click on individual building footprints on the map to view the exact year that it was built).
In truth these animated building age maps don't provide a true picture of how cities have grown over time. The maps only show the age of buildings that exist today. So what is missing from this map is historical buildings which have been replaced by newer buildings over time. However animating the maps by the age of build does provide a great sense of how and where cities have developed over the decades (or over the centuries in Amsterdam's case).
No comments:
Post a Comment